Oscilloscope & Spectrogram
User Guide
Stereo Modes
This app has three stereo modes:
- L+R: Display the average of both channels
- L&R: Display the left and right channels separately
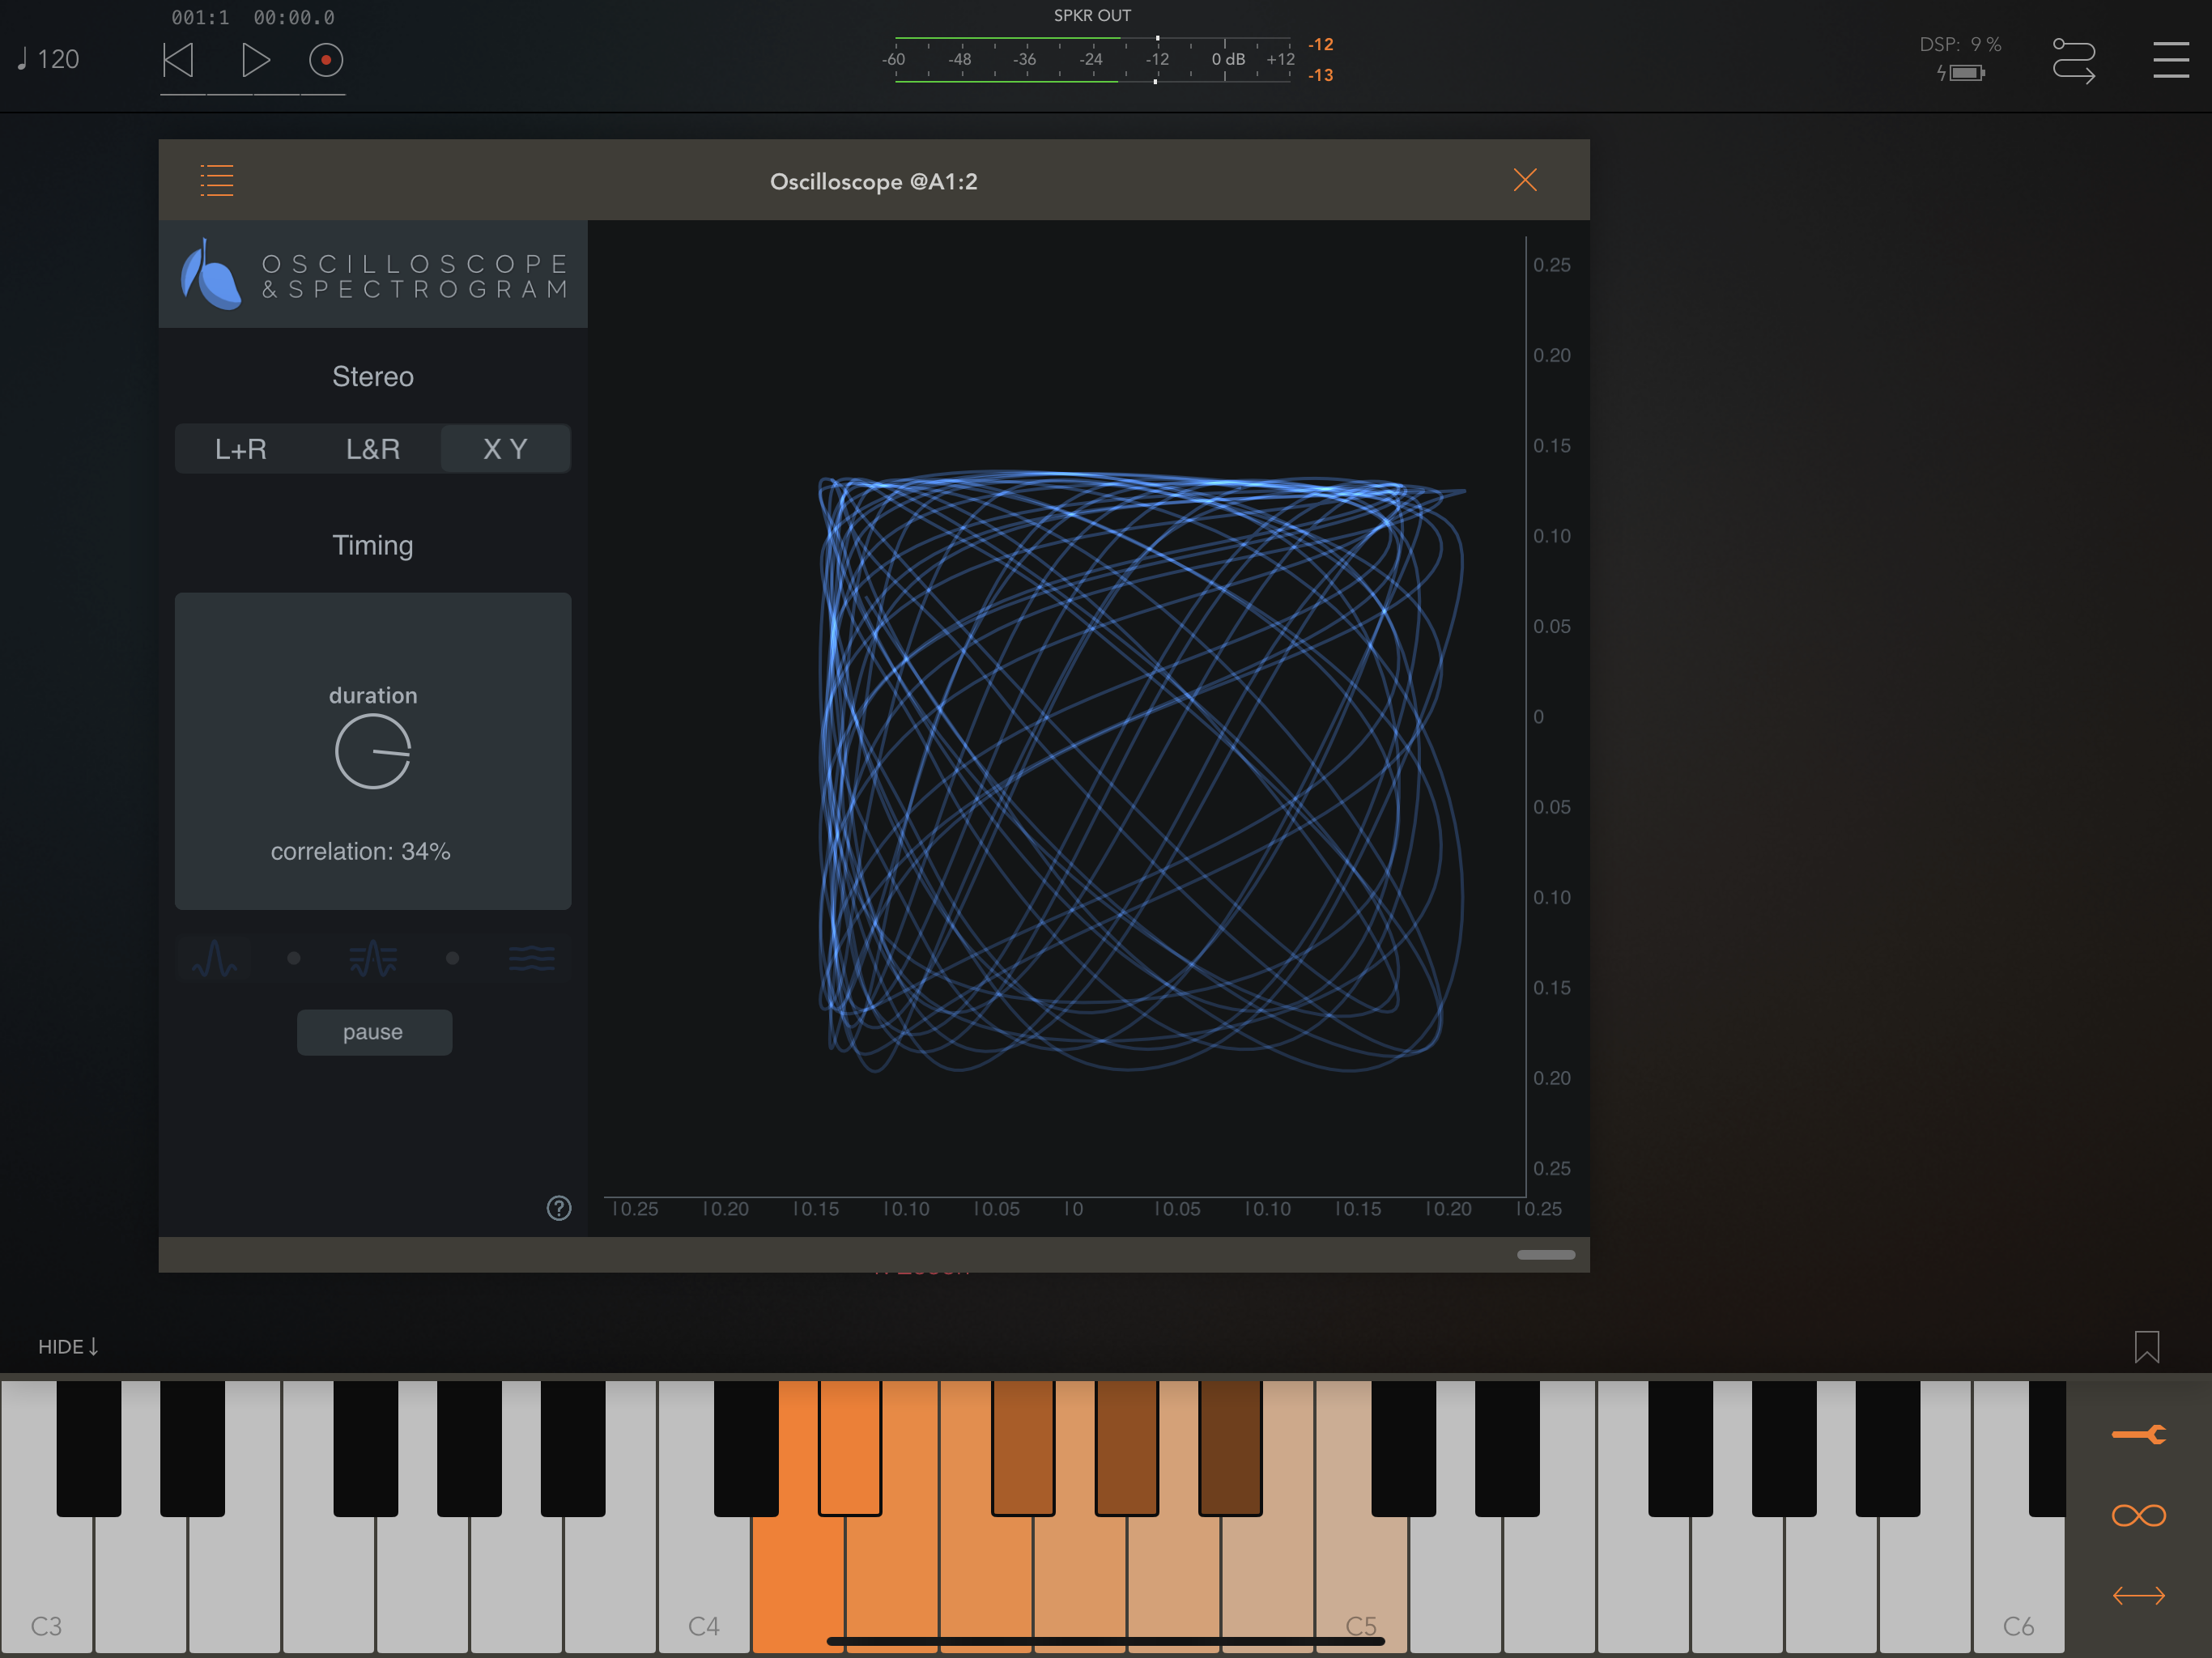
- XY: Display a vectorscope view with the left channel on the Y axis and the right channel on the X axis.
XY mode
The purpose of the XY mode is to visualise stereo width and identify phase cancellation problems that would cause your track to loose volume when someone hears it in mono. All mono signals produce a diagonal straight line on this graph. As the stereo width of the signal gets wider, it becomes more circular in shape.
On the timing panel of the XY mode there is a duration control. That determines the length of time represented on the graph. Below it is the correlation coefficient between the left and right channels. Normal stereo audio typically has stereo correlation between 0 and 100%. Mono signals have 100% correlation. If the correlation is consistently negative, that indicates phase problems between the two channels. In the worst case, a signal that has -100% correlation will come out silent when played in mono.
On the timing panel of the XY mode there is a duration control. That determines the length of time represented on the graph. Below it is the correlation coefficient between the left and right channels. Normal stereo audio typically has stereo correlation between 0 and 100%. Mono signals have 100% correlation. If the correlation is consistently negative, that indicates phase problems between the two channels. In the worst case, a signal that has -100% correlation will come out silent when played in mono.
Timing Modes
There are three timing modes:
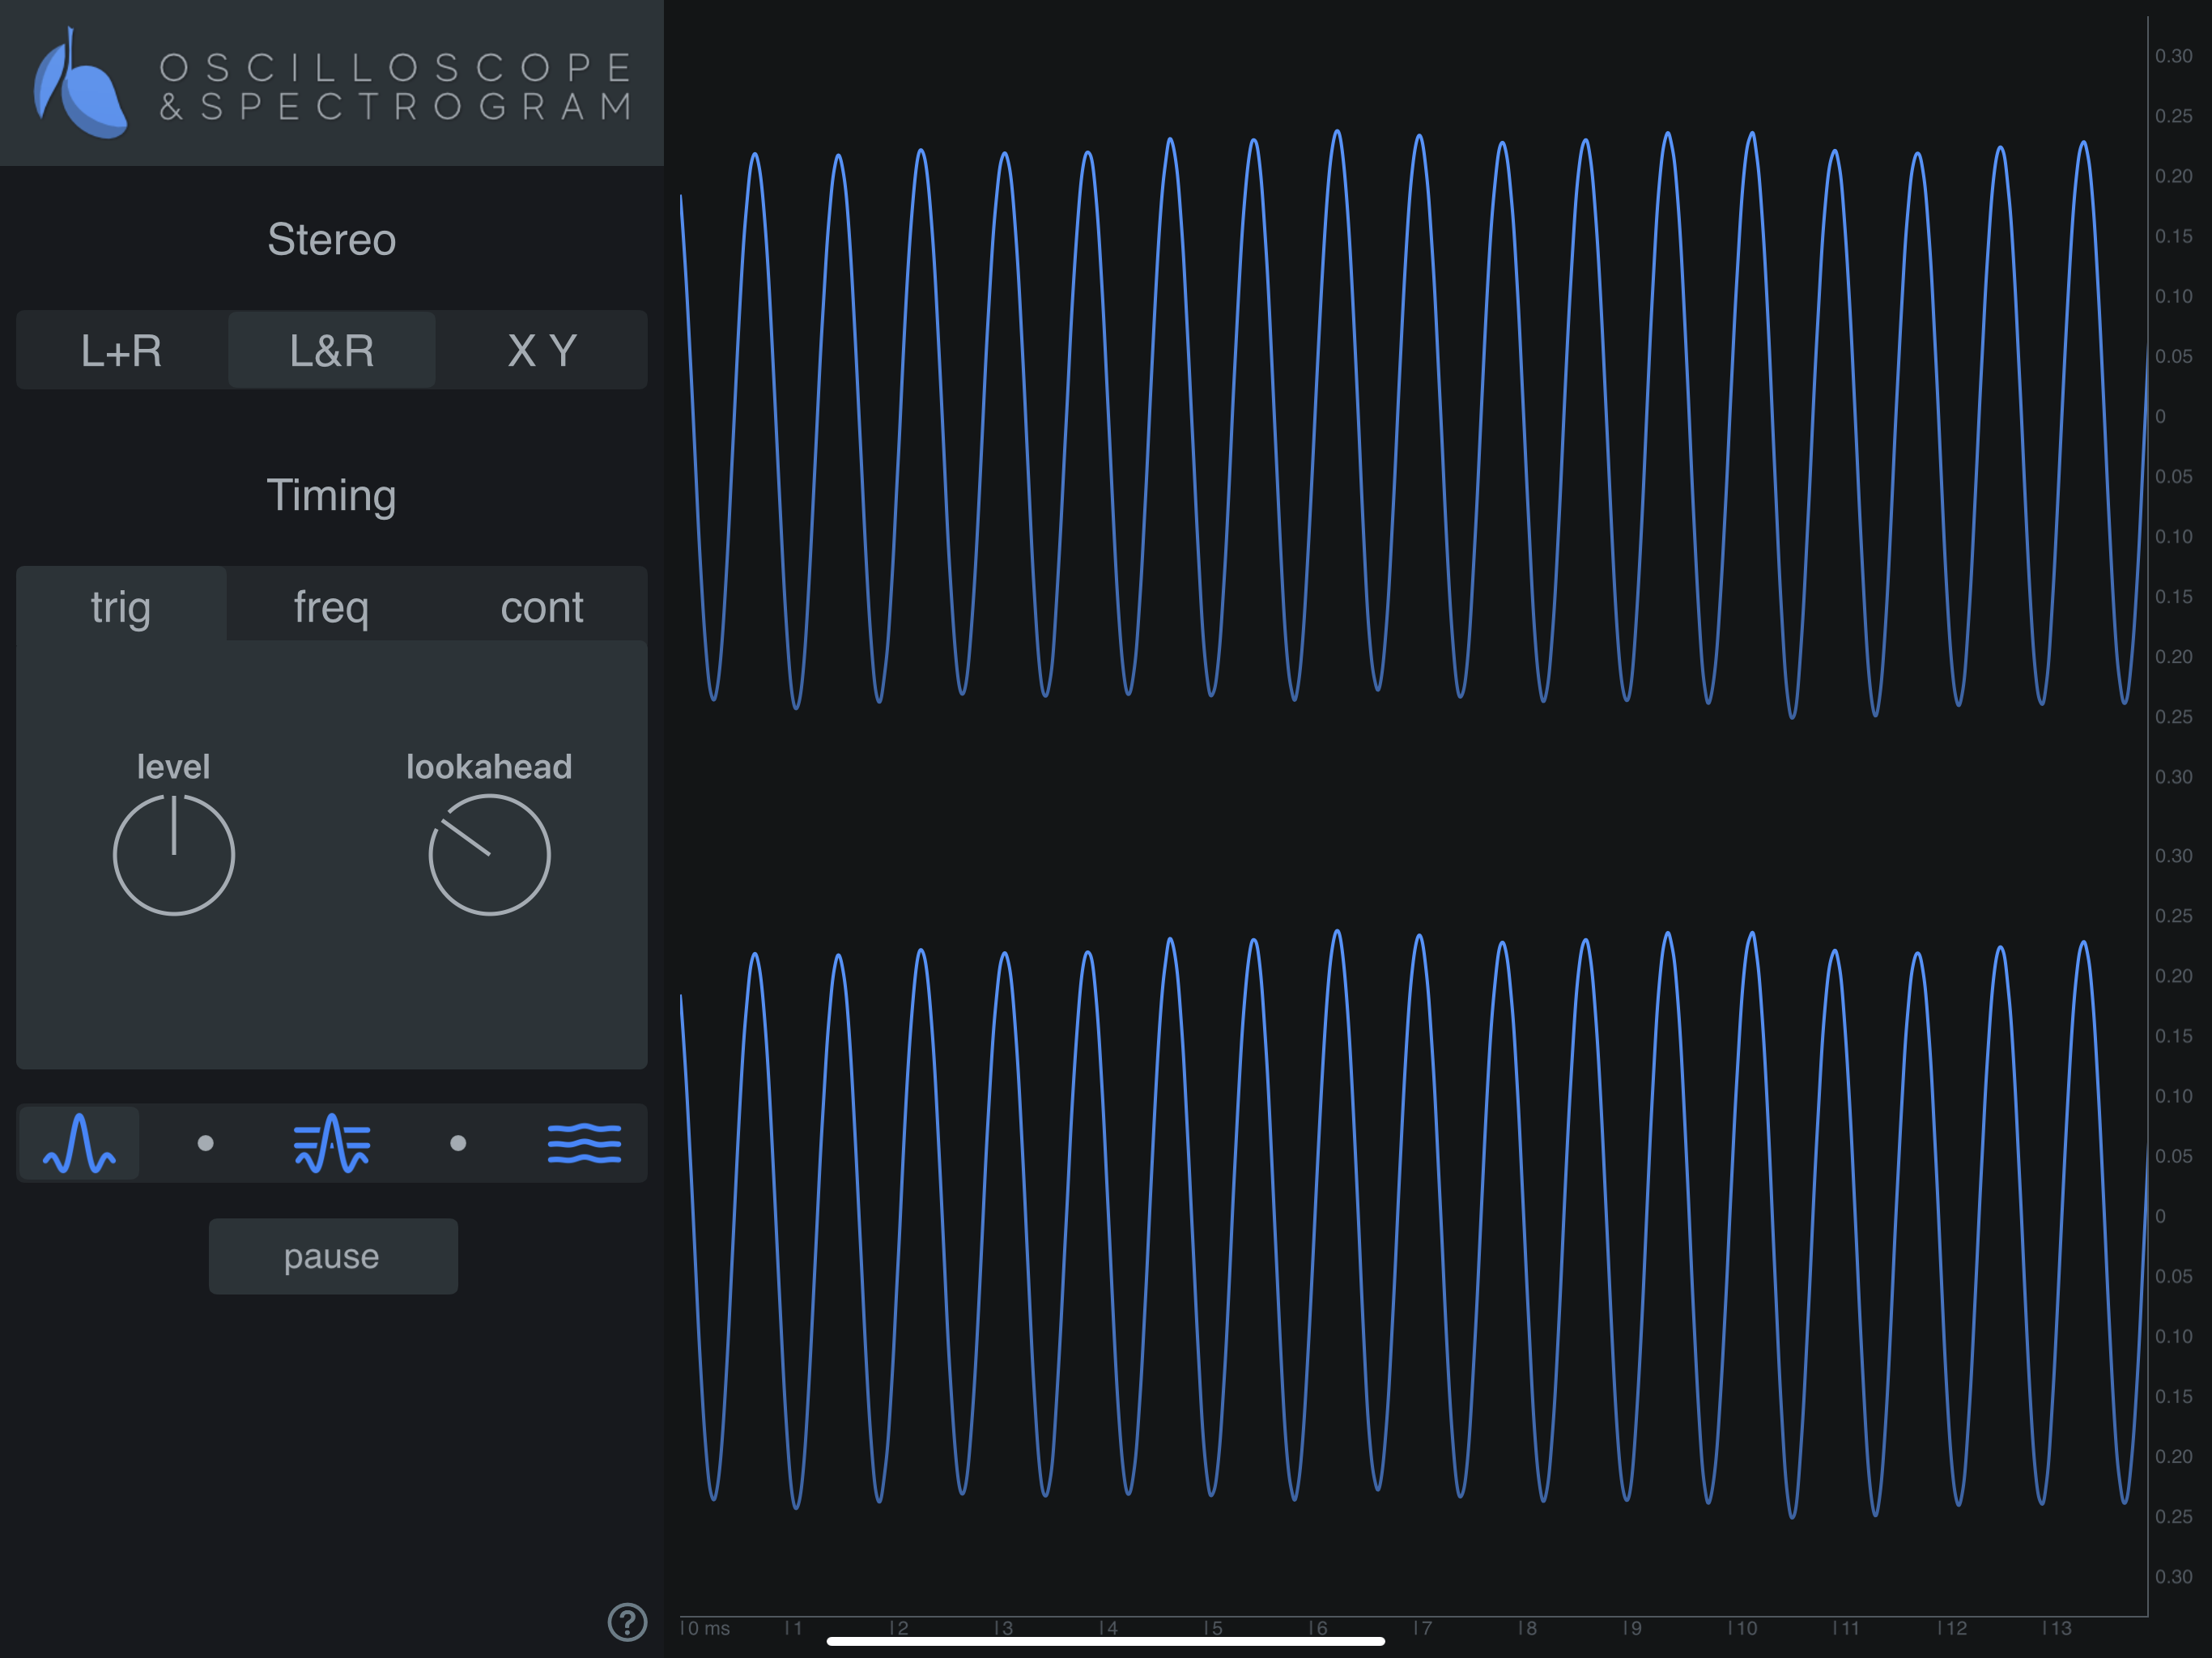
- Trig: Trigger drawing the screen when the input level crosses the threshold setting
- Freq: Trigger drawing the screen following a timer that is synchronised to the period of oscillation of the selected MIDI note.
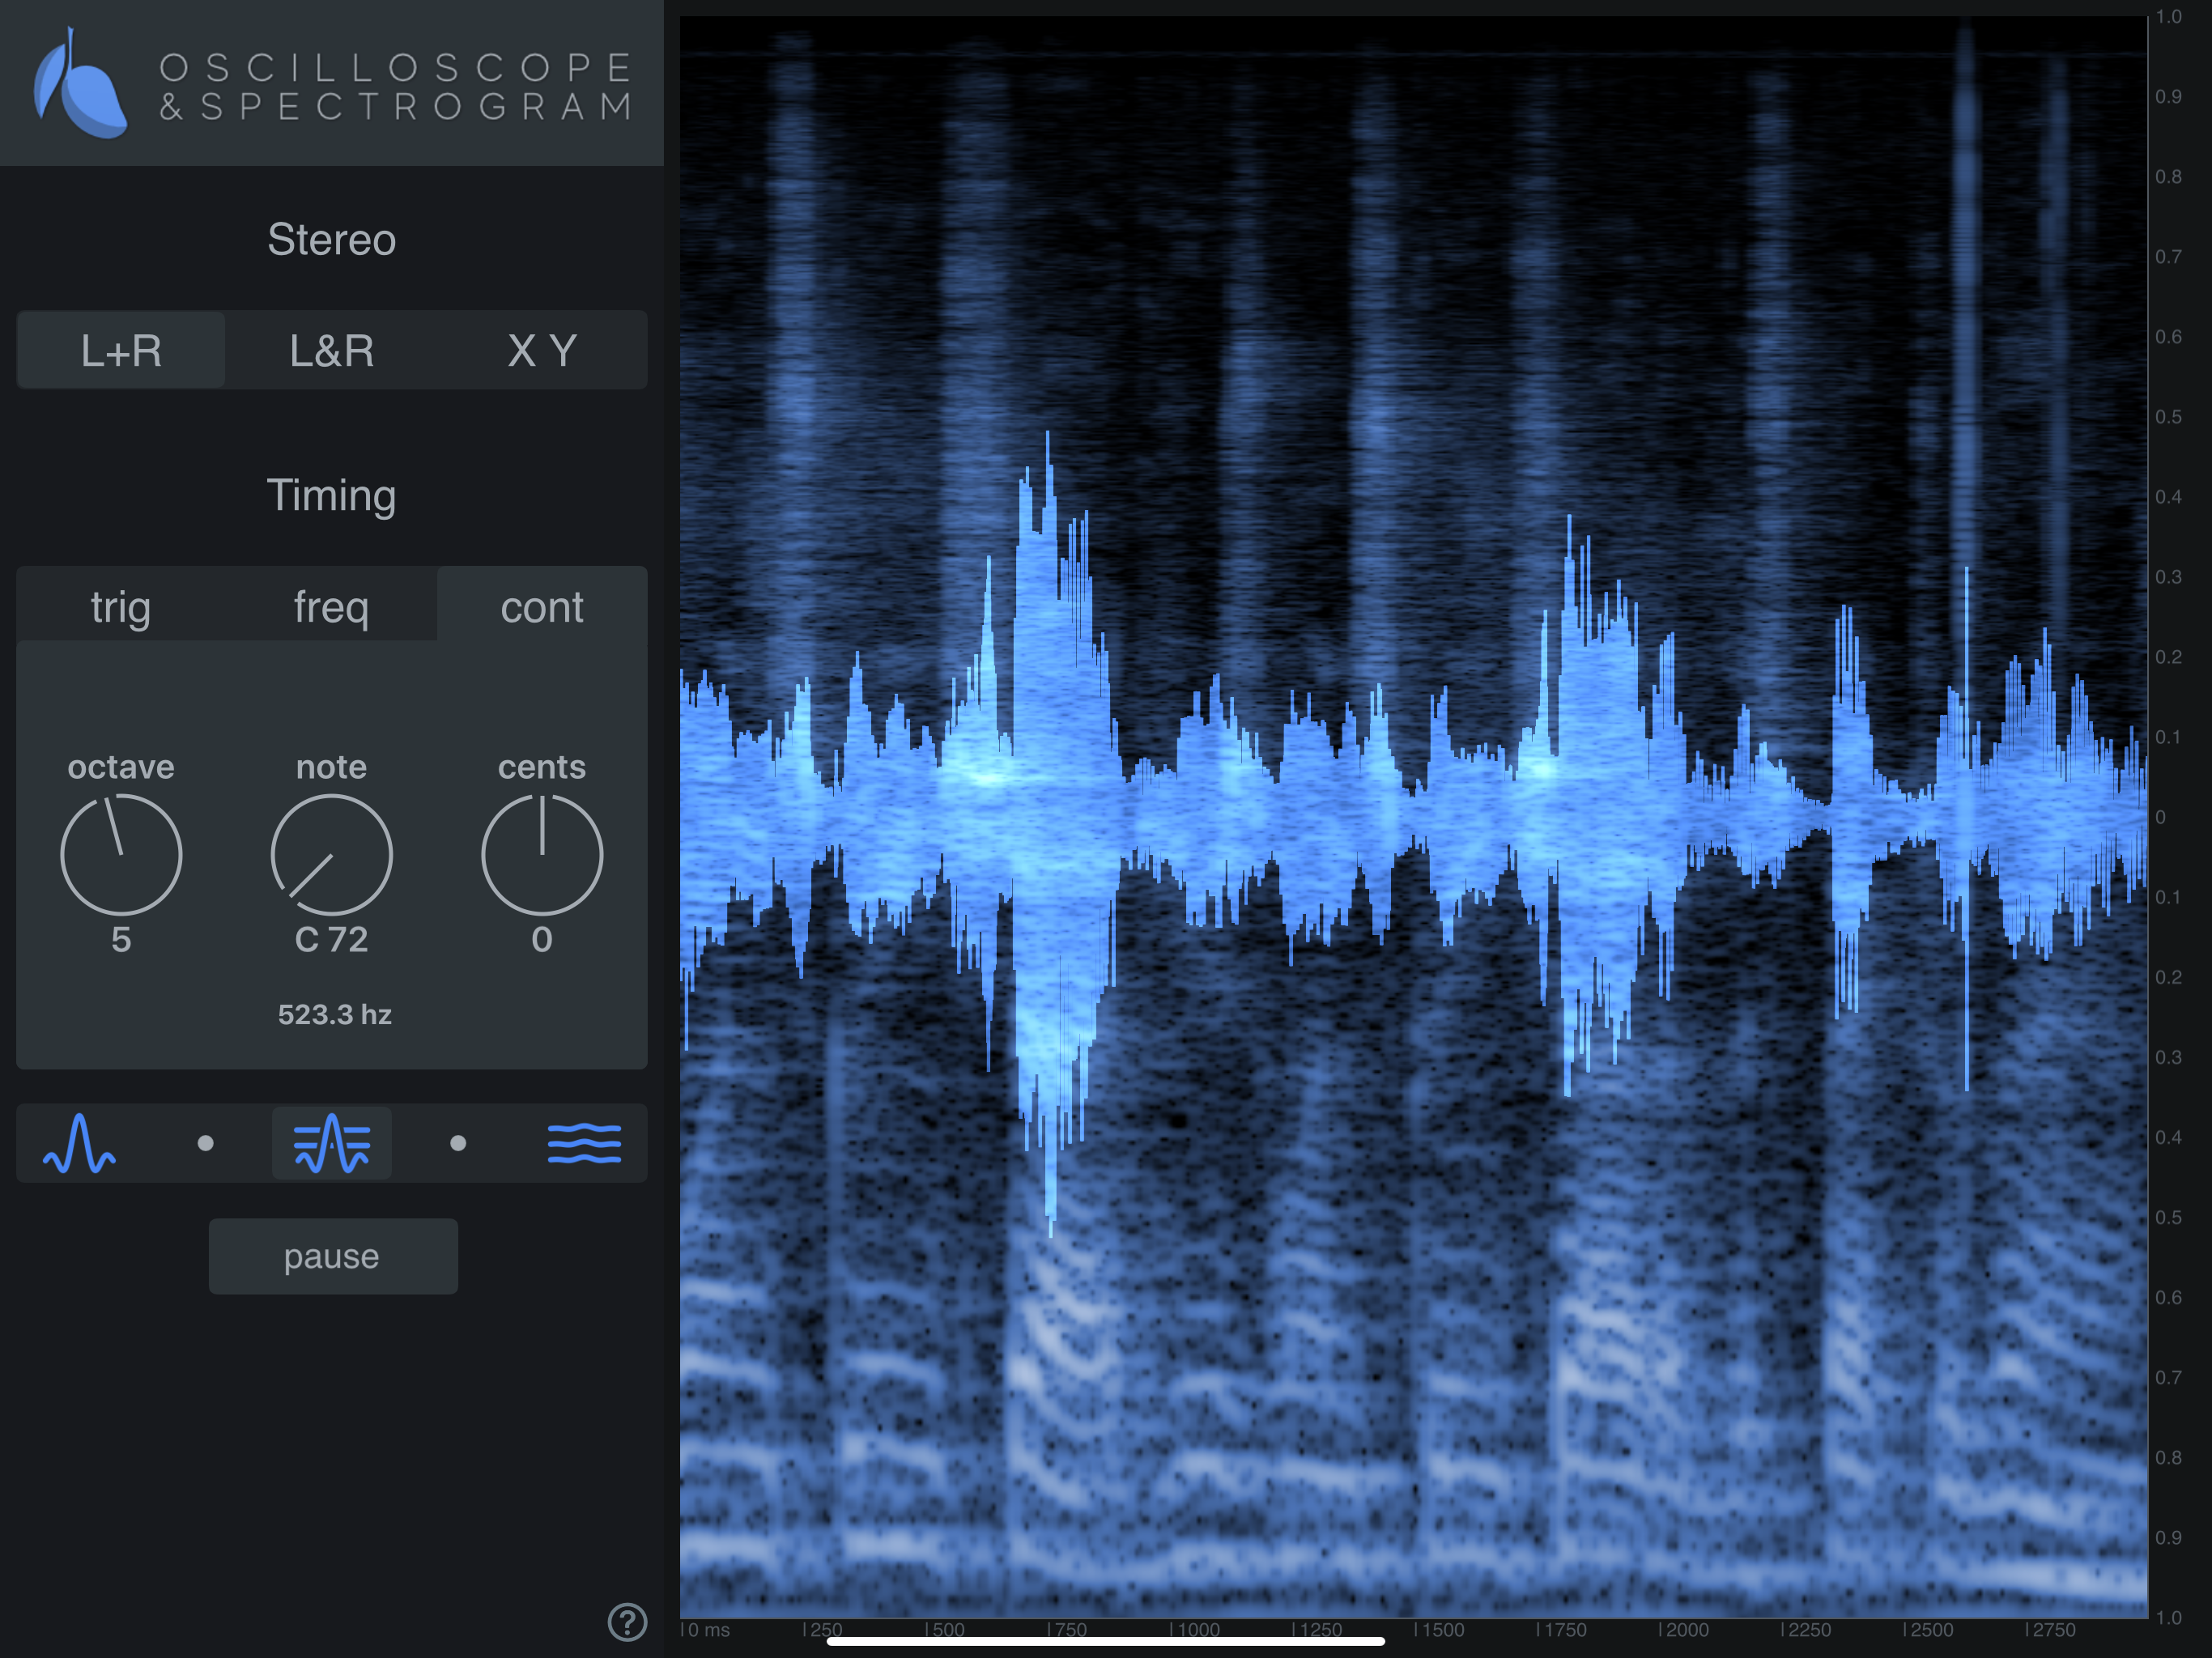
- Cont: Draw continuously all the time.
Trig (Trigger) mode
The trigger mode waits until the input crosses the selected threshold level before drawing to the screen. Trigger mode is useful for viewing the shape of synth waveforms in real time because it gives the appearance that the wave is standing still in place, making it easier to see. This mode clears the screen every three seconds. If you need to look for longer than three seconds, press the pause button.
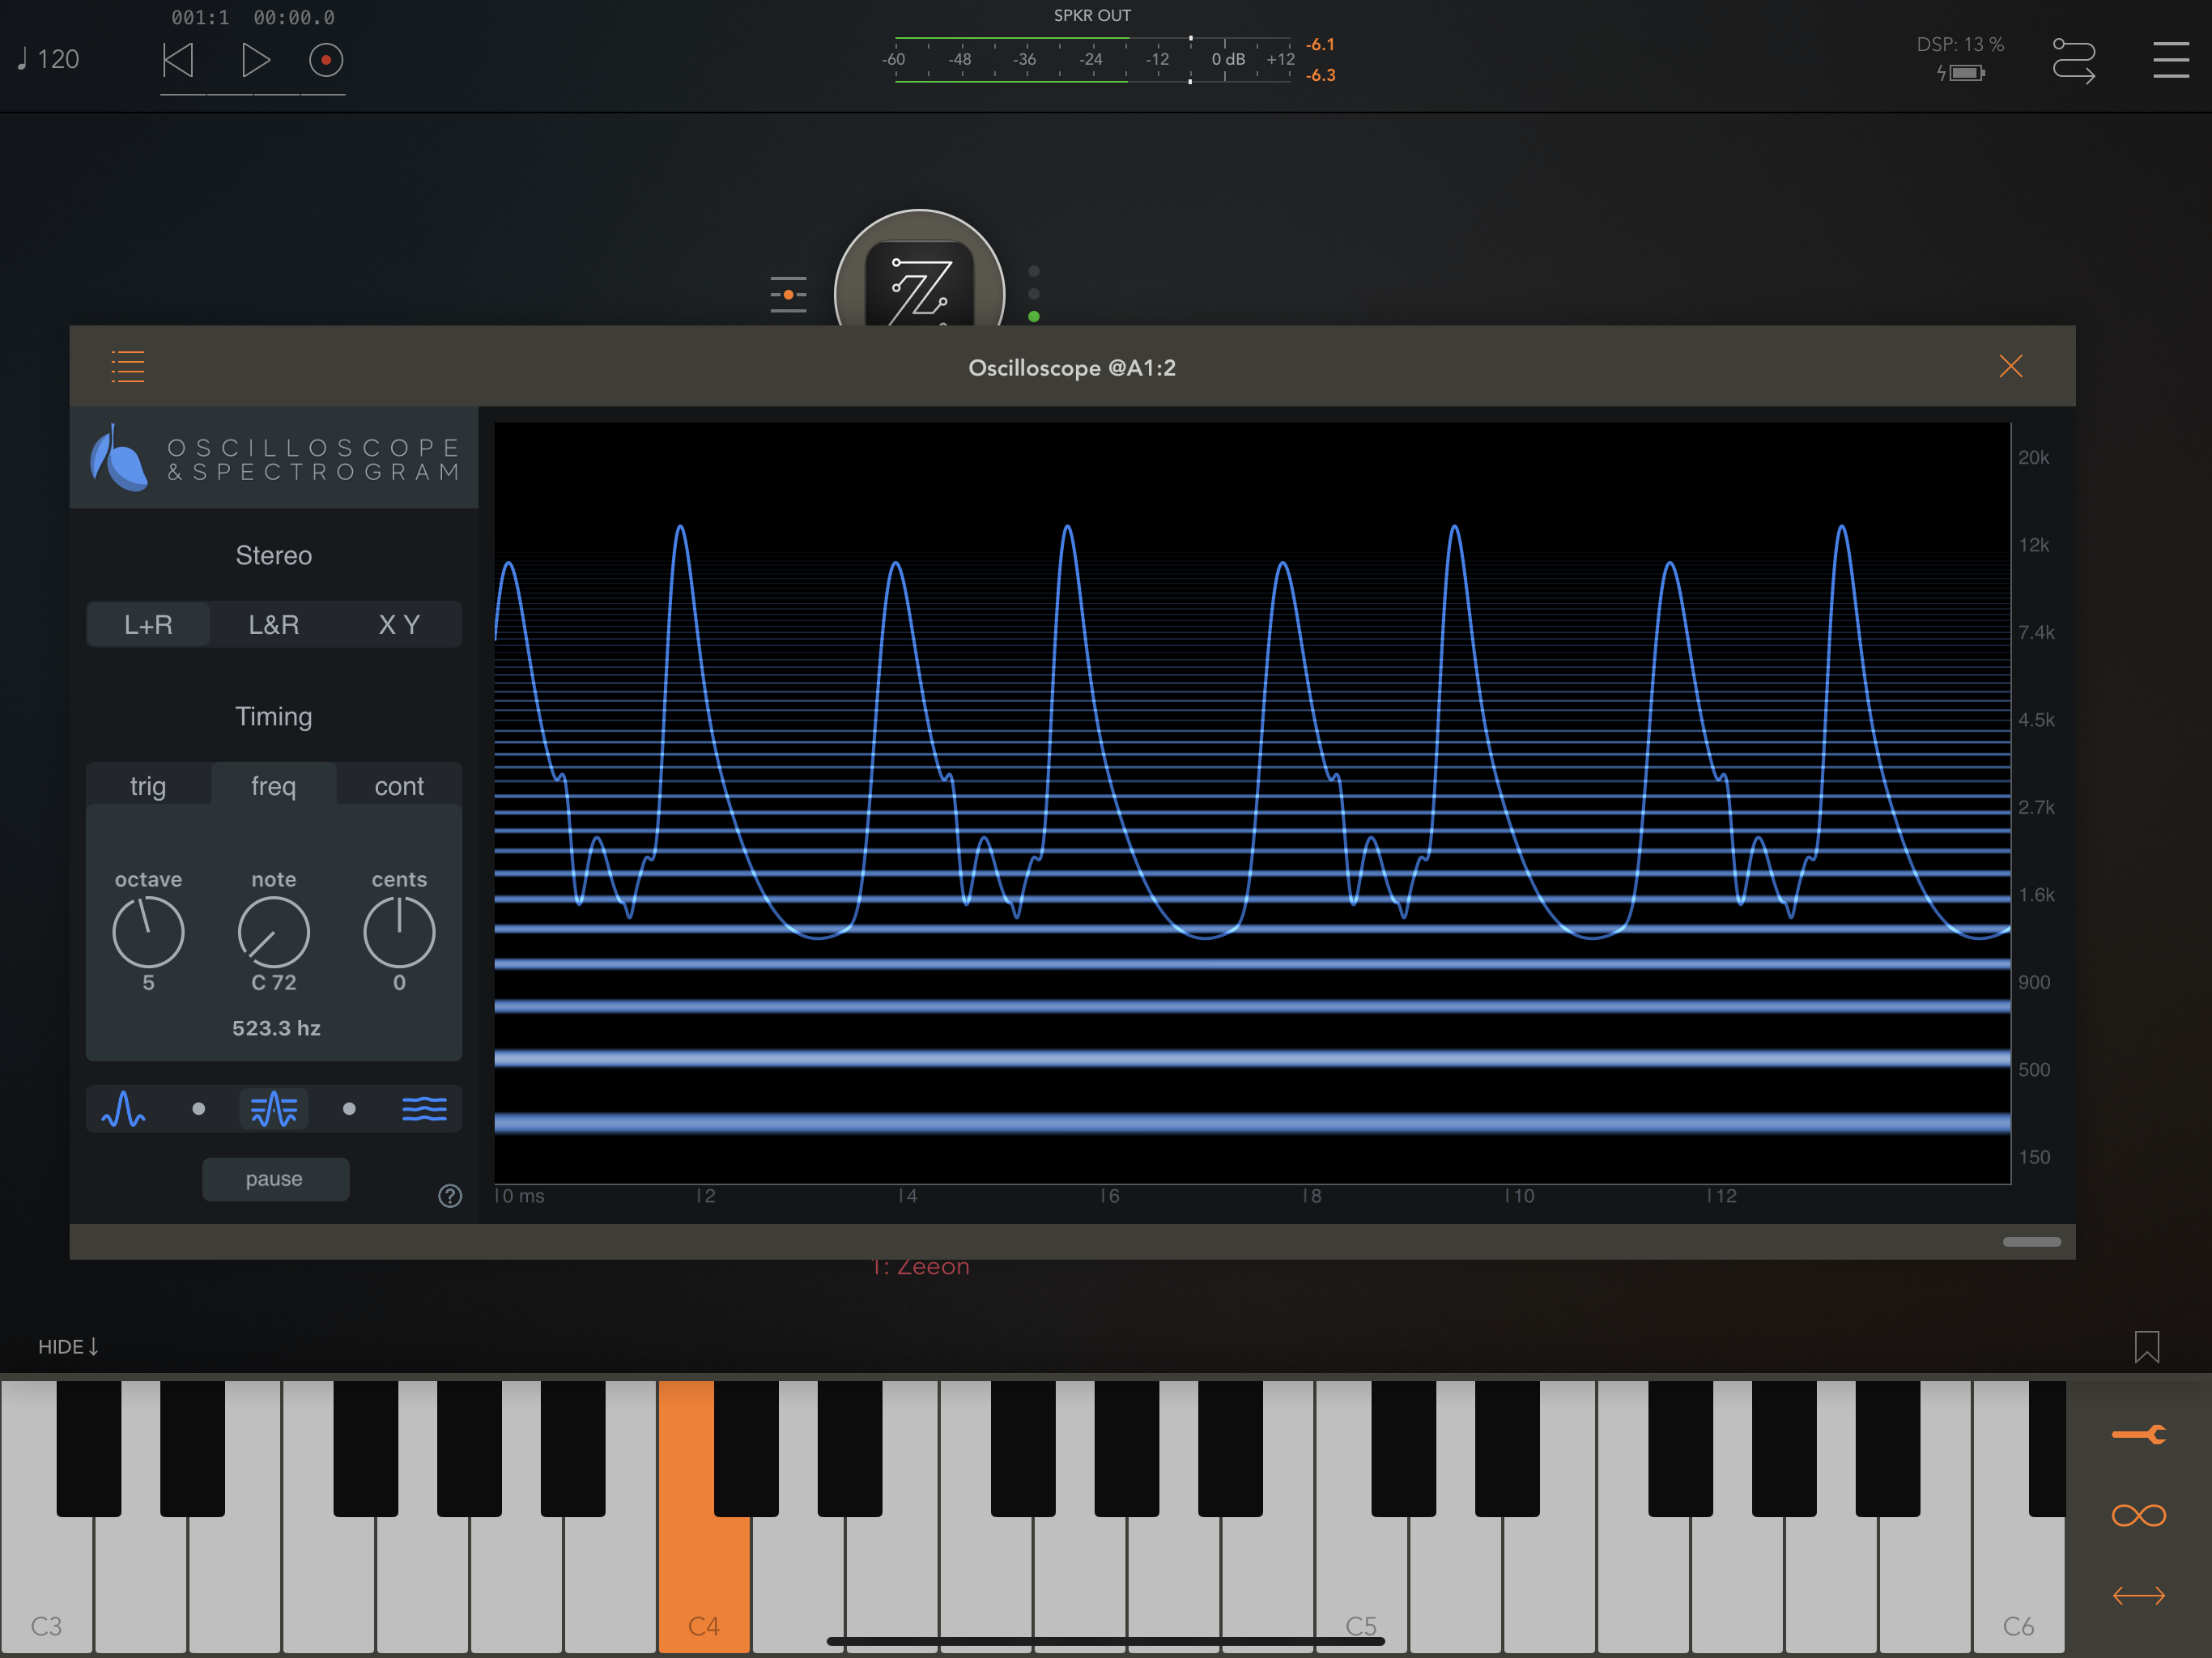
Freq (Frequency) mode
This mode uses a clock to trigger drawing the screen in time with the period of oscillation of the selected note. This is useful for precisely measuring the pitch of musical pitches. When you have the Octave, Note, and Cents controls set to the correct pitch you will see that the waveform on the screen appears to stand still on the screen.
In Freq mode (and also Cont mode) you can touch the axes label on the right most side of the app, to the right of the spectrogram view, and a horizontal line appears on the view to indicate the precise frequency you have selected. This is a good way to identify frequencies you see on the spectrogram, since the labels on the right are not dense enough to identify the exact frequency. When you touch to display the frequency line, the Octave and Note controls will move automatically to indicate the Octave and MIDI note corresponding to the frequency you have selected. To get an even more accurate selection, manually adjust the Cents control knob until the horizontal frequency line sits at precisely the right location.
In Freq mode (and also Cont mode) you can touch the axes label on the right most side of the app, to the right of the spectrogram view, and a horizontal line appears on the view to indicate the precise frequency you have selected. This is a good way to identify frequencies you see on the spectrogram, since the labels on the right are not dense enough to identify the exact frequency. When you touch to display the frequency line, the Octave and Note controls will move automatically to indicate the Octave and MIDI note corresponding to the frequency you have selected. To get an even more accurate selection, manually adjust the Cents control knob until the horizontal frequency line sits at precisely the right location.
Cont (Continuous) mode
Continuous mode draws all the time. It is useful for viewing audio over a long time scale. You can also use it to pause and zoom in on specific sound events you want to inspect more closely. Similar to the Frequency timing mode, Continuous mode displays the horizontal frequency line when you touch on the axes labels to the right of the spectrogram view.
Pause / Resume button
Any time you need to stop and look at something more carefully, press the pause button to stop drawing the spectrogram and oscilloscope. When paused you can zoom and pan to see more detail. Please remember to press resume when you are done looking.
Pinch gestures to zoom
At any time you can use pinch gestures on the spectrogram view to set the horizontal and vertical zoom of the graph. The spectrogram has horizontal zoom but not vertical. The oscilloscope waveform has both horizontal and vertical zoom.
In continuous mode you can also swipe left and right to pan back to a previous time. In continuous mode the app always saves the last several seconds of audio.
In continuous mode you can also swipe left and right to pan back to a previous time. In continuous mode the app always saves the last several seconds of audio.
Double tap to reset controls
Most controls in the app reset back to their defaults when you double tap on them. You can also reset the zoom settings by double-tapping on the axes labels of the spectrogram view.
Oscilloscope / Spectrogram visibility control
Near the bottom of the control menu is a five-position selector that sets the visibility of the oscilloscope and spectrogram. You can display oscilloscope waveform only, spectrogram only, or three mixed opacity blended settings in between.
Features
Combined oscilloscope and Spectrogram
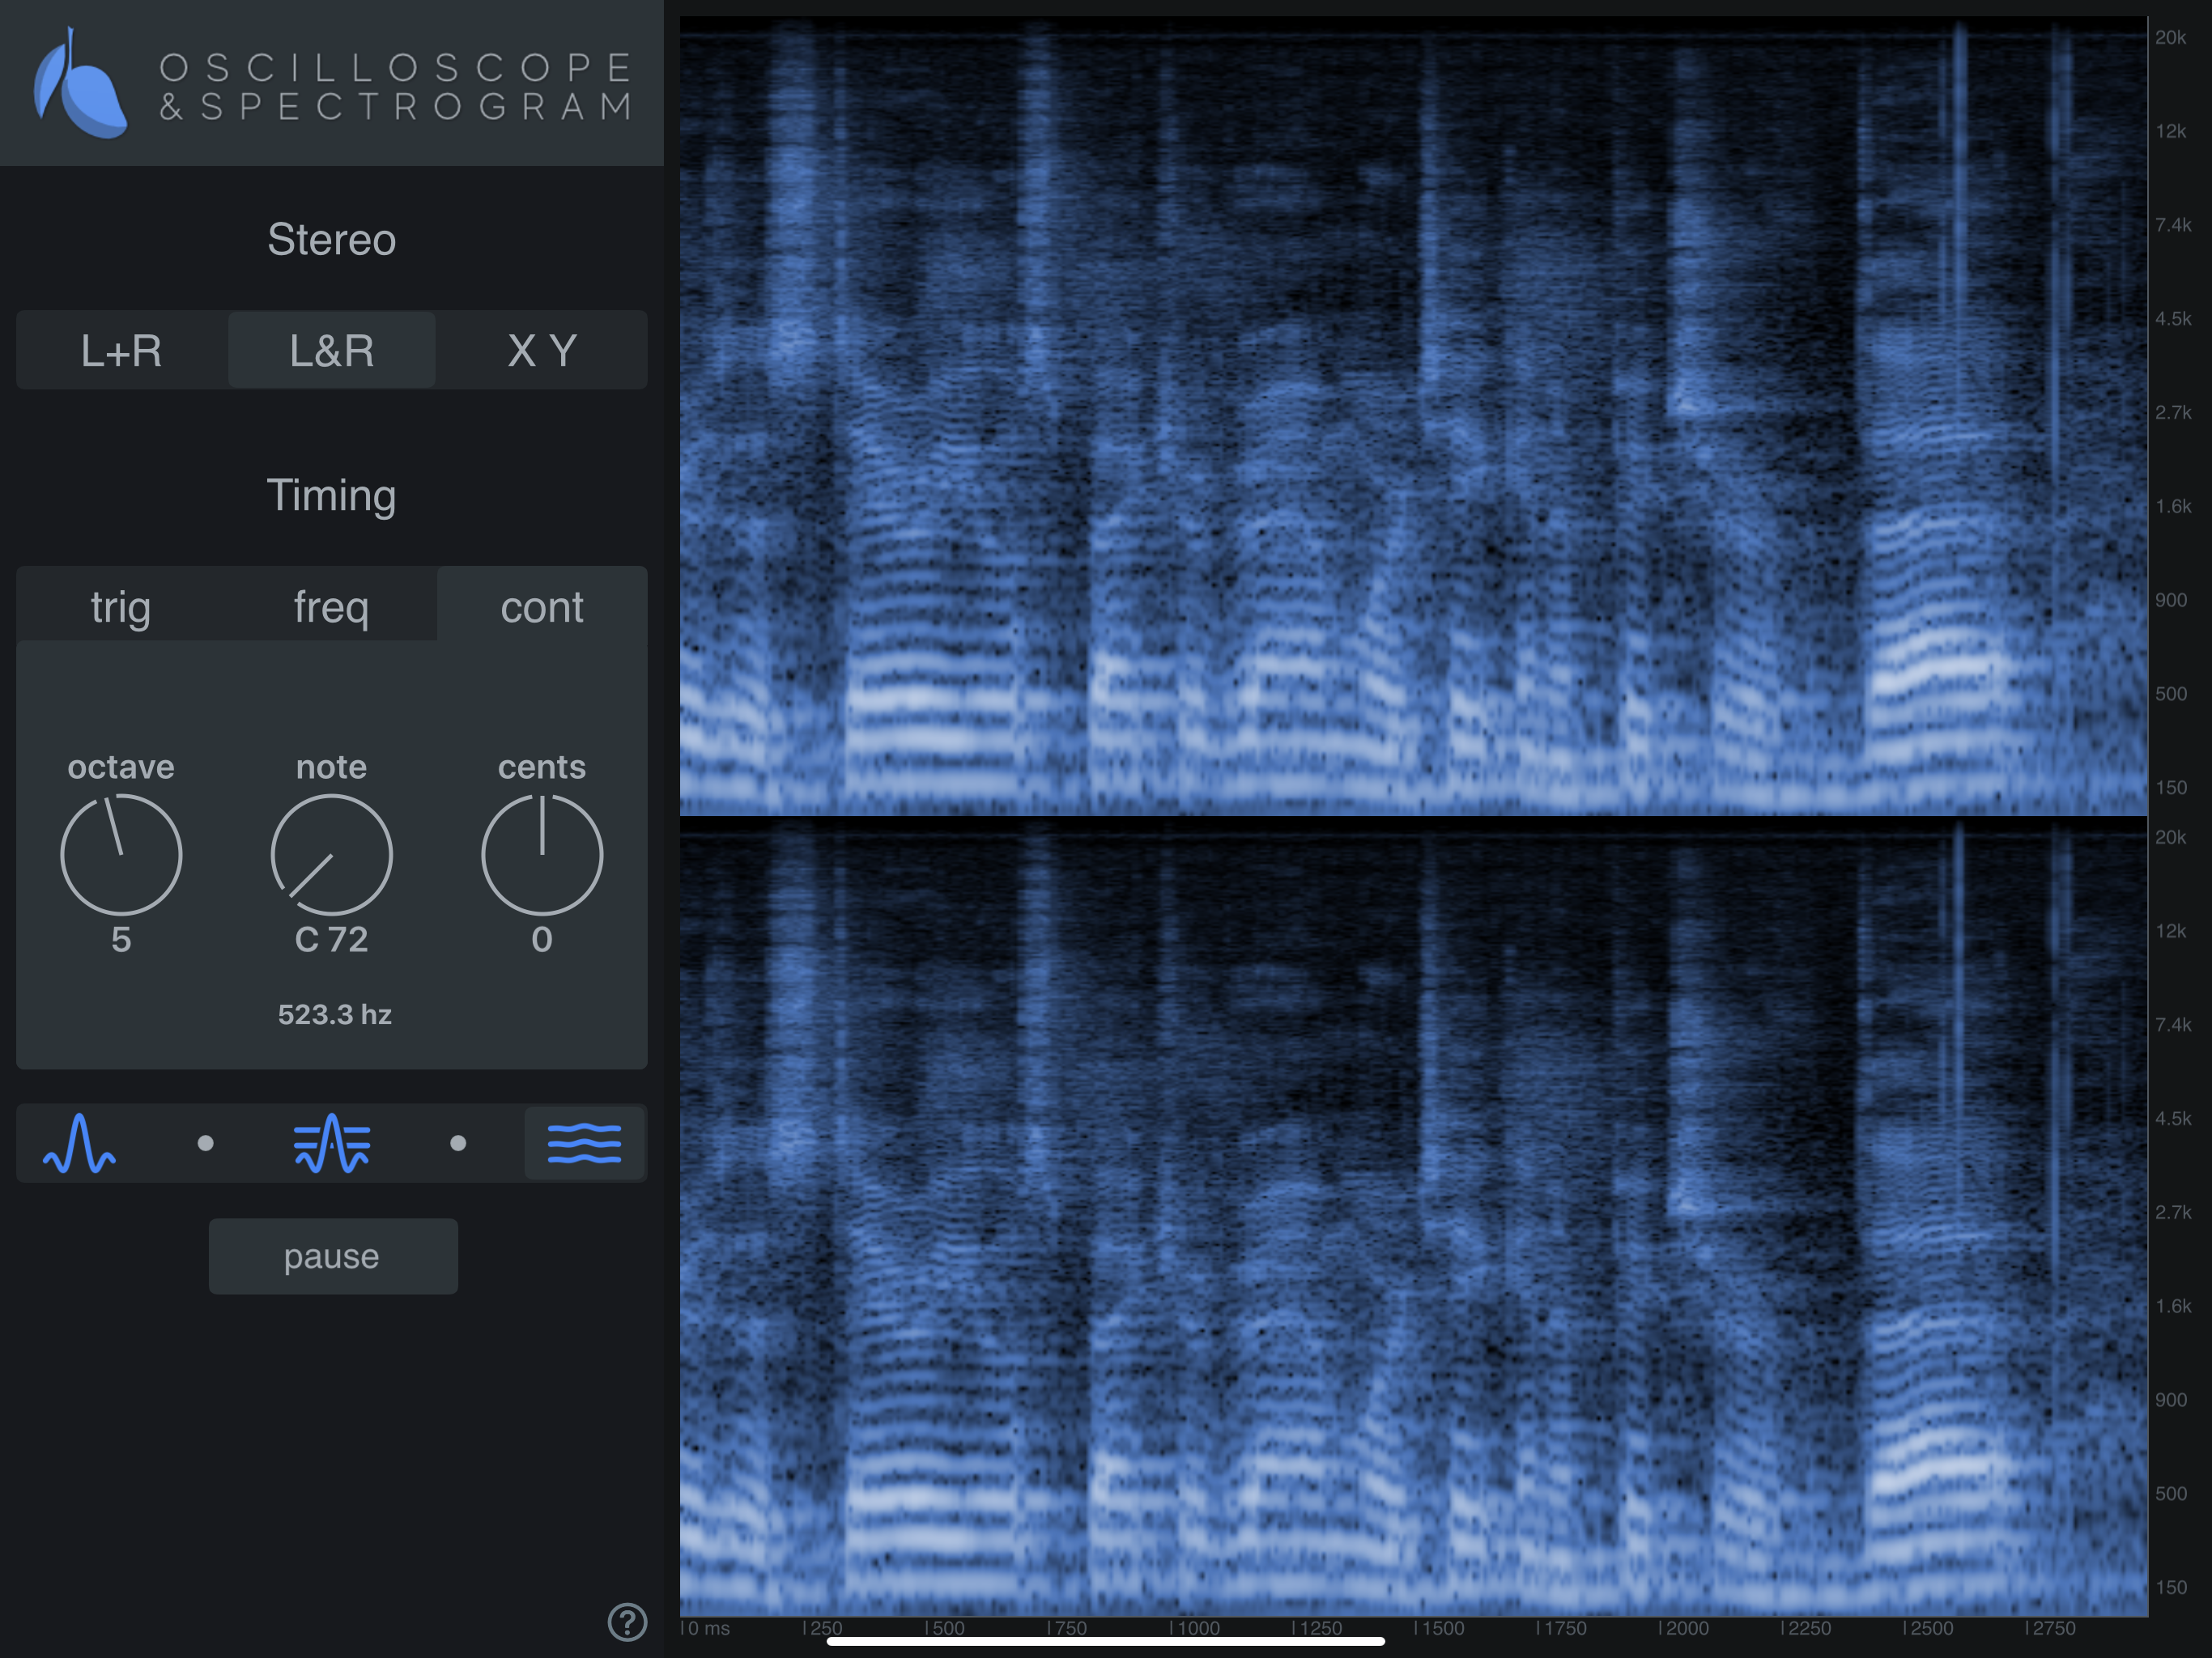
View L and R channels separately
Oversampled for smooth, accurate view of high frequencies at short time scales
X-Y vectorscope for visualising changes in the stereo field
It works seamlessly in a wide variety of DAW apps.